Some conditions - such as obesity, depression and functional odor disorders - come with a social stigma. Understanding the etiology of these conditions helps to avoid stereotypes and find remedies.
Read more
We do not inherit our ponds from previous generations, we borrow them from the future ones. We need to maintain them for their beauty, for their cultural significance, for next generations of people and other inhabitants of the Earth. Read more
Diseases and conditions caused by microorganisms can be difficult to diagnose. Even in such seemingly simple case as avian flu there could be many different infectious agents causing it, so new molecular diagnostic techniques are constantly developed and refined.
We don't have all our test results yet, but have already started analyzing available data. Regression analyses of 153 gut microbiome samples show that MEBO score (a composite score derived from answers to questions pertaining to odor or PATM symptoms) can be explained by combined levels of several dozen microorganisms. Some of them make symptoms worse, while others neutralize the odors or PATM aura.

Here is one example: Epulopiscium
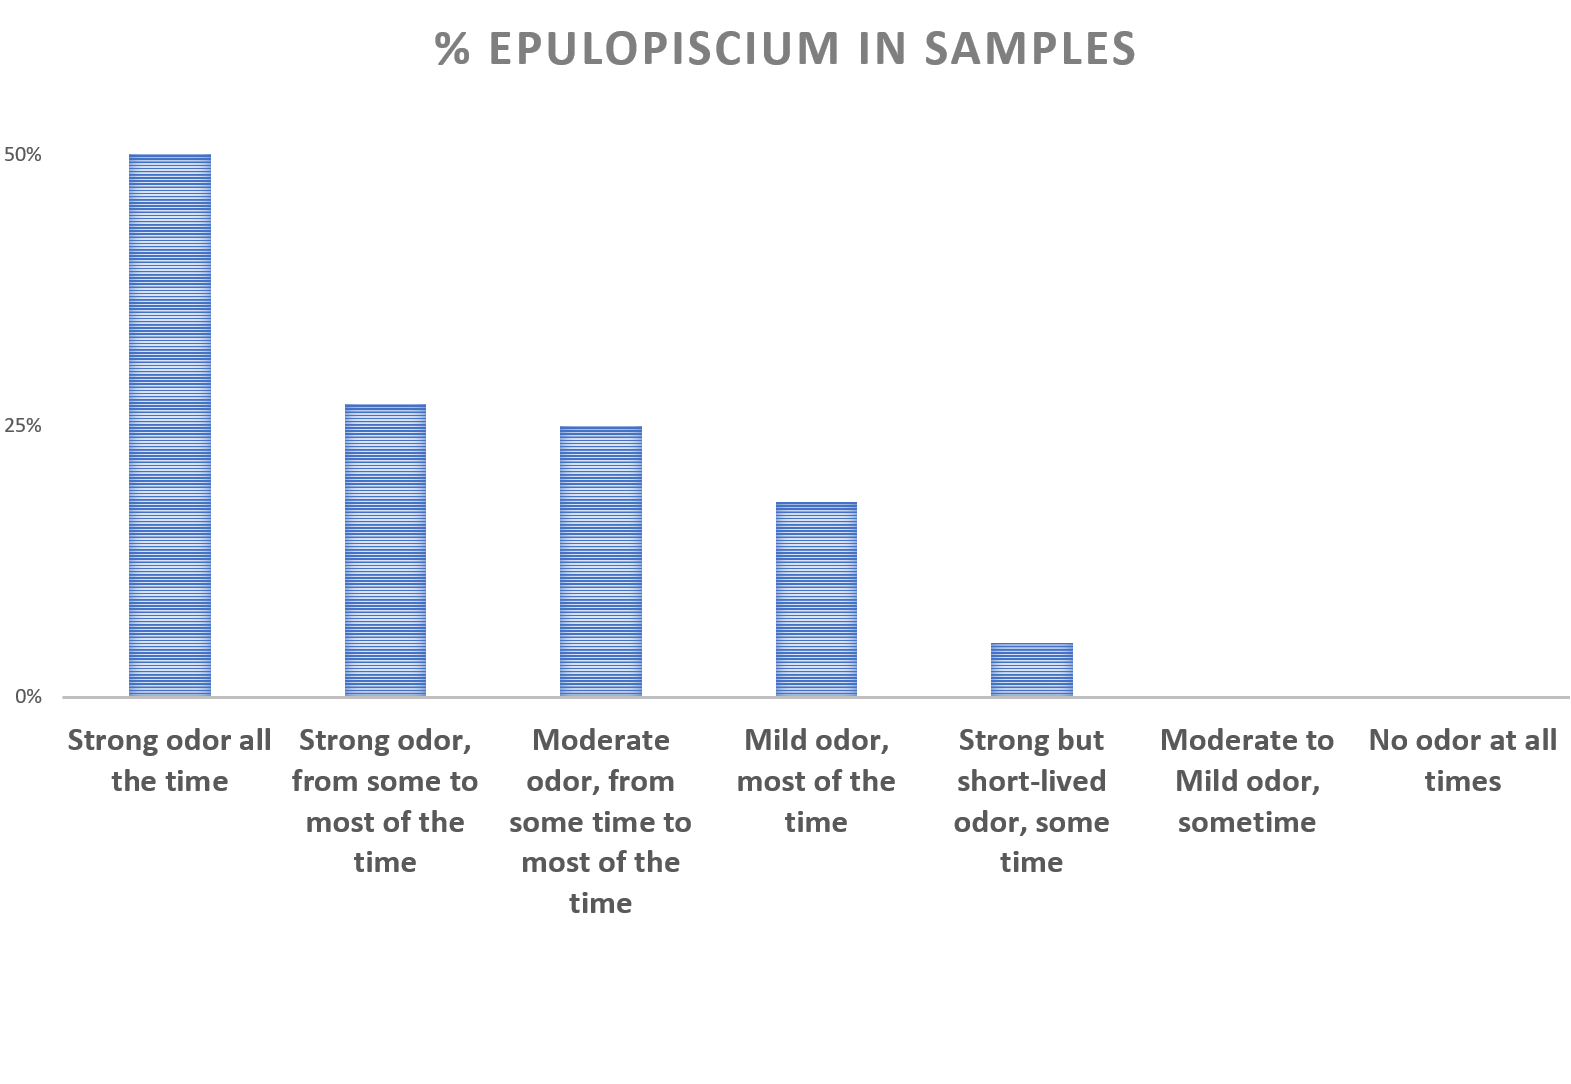 Epulopiscium was found in only 5% of general population that tested with uBiome. But we see a much higher percentage of samples with these bacteria in our dataset, depending on the symptoms reported.
Here is one example: Epulopiscium
Discovered in the gut of the brown surgeonfish, Epulopiscium actually means "guest at a banquet of fish." It's a large bacteria - the size of a hyphen in a printed text, visible to the naked eye.
Epulopiscium was found in only 5% of general population that tested with uBiome. But we see a much higher percentage of samples with these bacteria in our dataset, depending on the symptoms reported.
It's prevalence could be as high as in 50% of the sufferers experiencing the worst symptoms, decreasing as symptoms lessen. The prevalence of this bacteria in those with strong but rarely manifested symptoms is about the same as in general population, but we never observed these bacteria in those with mild occasional symptoms or no symptoms at all.
Of course, this is not the only responsible microorganism for odors or PATM. We will be reporting more, along with what seem to help in reducing the levels.
We will also tell about bacteria "neutralizing" the odors, found in remission. Some of them are antiinflammatory, others help with digestion. Interestingly, a number of butyric acid-producing microbes also seem to help, even though butyric acid is not supposed to smell pleasant. We'll talk about it next time.
 Over hundred people agreed to participate in our study. Half of them went through all the
steps
and let us have results of all 3 test kits (last digits of their IDs are listed next to the image of a star with thumbs up).
Over a dozen submitted
questionnaires with one or two samples - which was also very helpful.
And almost half did not do anything (listed next to the red "thumbs down" sign). We understand that unforeseeable things happen, and
commitments may be difficult to fulfill. Still, it is worth to look if there is anything in common among those who did not submit samples and QoL questionnaires. Were those mostly our "new friends"?
Over hundred people agreed to participate in our study. Half of them went through all the
steps
and let us have results of all 3 test kits (last digits of their IDs are listed next to the image of a star with thumbs up).
Over a dozen submitted
questionnaires with one or two samples - which was also very helpful.
And almost half did not do anything (listed next to the red "thumbs down" sign). We understand that unforeseeable things happen, and
commitments may be difficult to fulfill. Still, it is worth to look if there is anything in common among those who did not submit samples and QoL questionnaires. Were those mostly our "new friends"?
 The answer is may be, but it's not that simple.

We'll be also looking at different subgroups of bacteria - such as Enterobacteria that reduces TMAO to TMA Multiple research studies including correlation of metabolomic data from mixed microbiota fermentation systems did not give a true picture of which members of the gut microbiota were responsible for converting TMAO to TMA, and we hope to get a better insight.
We also have 21 sets of "good" and "bad" days for the same individuals that will help us to understand what improves or worsens MEBO and PATM symptoms.
REFERENCES
Hoyles L, Jiménez-Pranteda ML, Chilloux J, Brial F, Myridakis A, Aranias T, Magnan C, Gibson GR, Sanderson JD, Nicholson JK, Gauguier D. Metabolic retroconversion of trimethylamine N-oxide and the gut microbiota. Microbiome. 2018 Dec;6(1):73.
Qiu L, Tao X, Xiong H, Yu J, Wei H. Lactobacillus plantarum ZDY04 exhibits a strain-specific property of lowering TMAO via the modulation of gut microbiota in mice. Food & function. 2018;9(8):4299-309.
Gabashvili IS. Community-led research discovers links between elusive symptoms and clinical tests. bioRxiv. 2017 Jan 1:139014.
Of course, this is not the only responsible microorganism for odors or PATM. We will be reporting more, along with what seem to help in reducing the levels.
We will also tell about bacteria "neutralizing" the odors, found in remission. Some of them are antiinflammatory, others help with digestion. Interestingly, a number of butyric acid-producing microbes also seem to help, even though butyric acid is not supposed to smell pleasant. We'll talk about it next time.
Over hundred people agreed to participate in our study. Half of them went through all the
steps
and let us have results of all 3 test kits (last digits of their IDs are listed next to the image of a star with thumbs up).
Over a dozen submitted
questionnaires with one or two samples - which was also very helpful.
And almost half did not do anything (listed next to the red "thumbs down" sign). We understand that unforeseeable things happen, and
commitments may be difficult to fulfill. Still, it is worth to look if there is anything in common among those who did not submit samples and QoL questionnaires. Were those mostly our "new friends"?
The answer is may be, but it's not that simple.
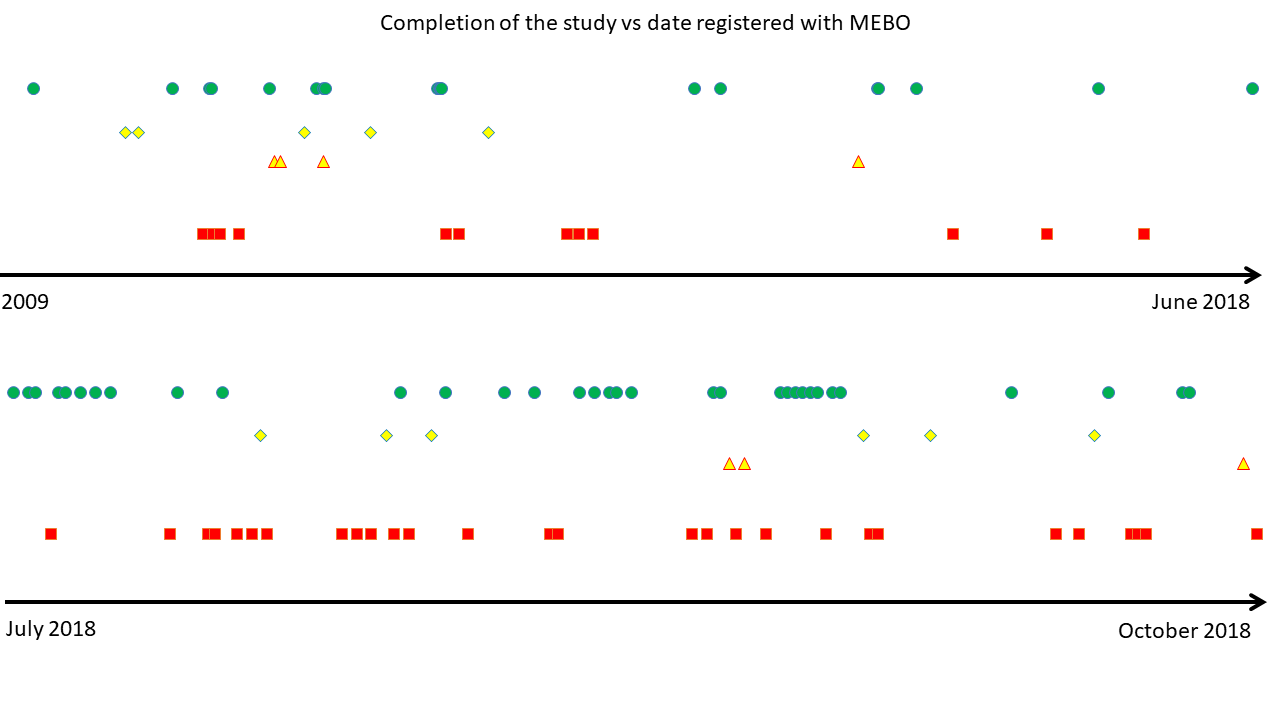
The figure shows when participants of our trial were registered with MEBO - before or after the first stages of our uBiome study.
Percentage of those who did not return any samples (red squares) was 30% for those who participated in prior MEBO activities
vs 40% for newly signed individuals.
(The ratio of our Study "Stars" (those who returned all kits and answered all associated QoL questions ) vs those who did not return the kits was 60% for "old friends" vs 80% for "new friends").
Yet, the figure shows that
"stars" (green circles) and "no-shows" (red squares) tend to "cluster", and possibly associate together. Perhaps associations are indicators of the values we value? Show me your true friends and I'll tell you who you are?
We are still waiting for the 4th batch of sequences/taxonomies and are incorporating more data from different sources for our NCT03582826 study, but have already started looking at the available data.
Our previous trials showed that while there is no one-size-fits-all solution to MEBO and PATM symptoms, some metabolite measurements and self-reported data can distinguish different subtypes of these conditions with very high accuracy.
Hence, we may need different treatments for sufferers with different metabolism - for example, abilities to process sugar in their food or higher production of putrescine in urine (could it be due to pseudomonas and enterobacteria in the gut?).
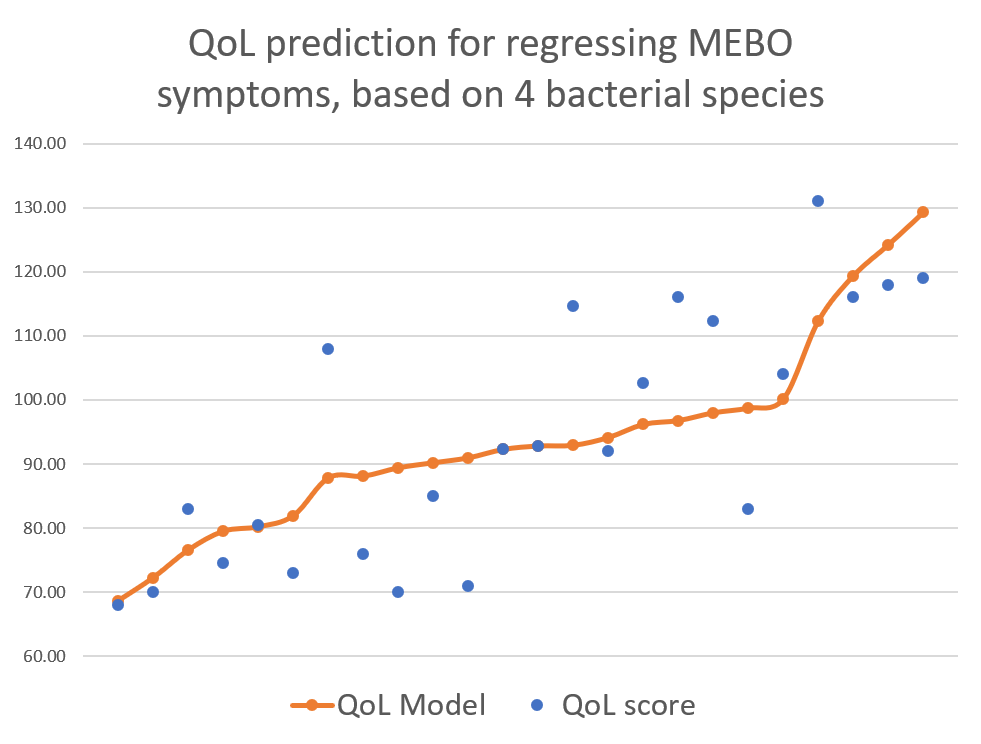
Our previous studies had much fewer variables differentiating MEBO subtypes and fewer participants (NCT02692495: 16 viable samples from 11 men and 5 women; NCT02683876: 15 viable samples from 10 women and 5 men). We are now collecting the biggest ever MEBO dataset for the current study, NCT03582826, with about 5 times larger number of participants than previous studies. One of the questions asked in QoL survey was whether participant's condition was
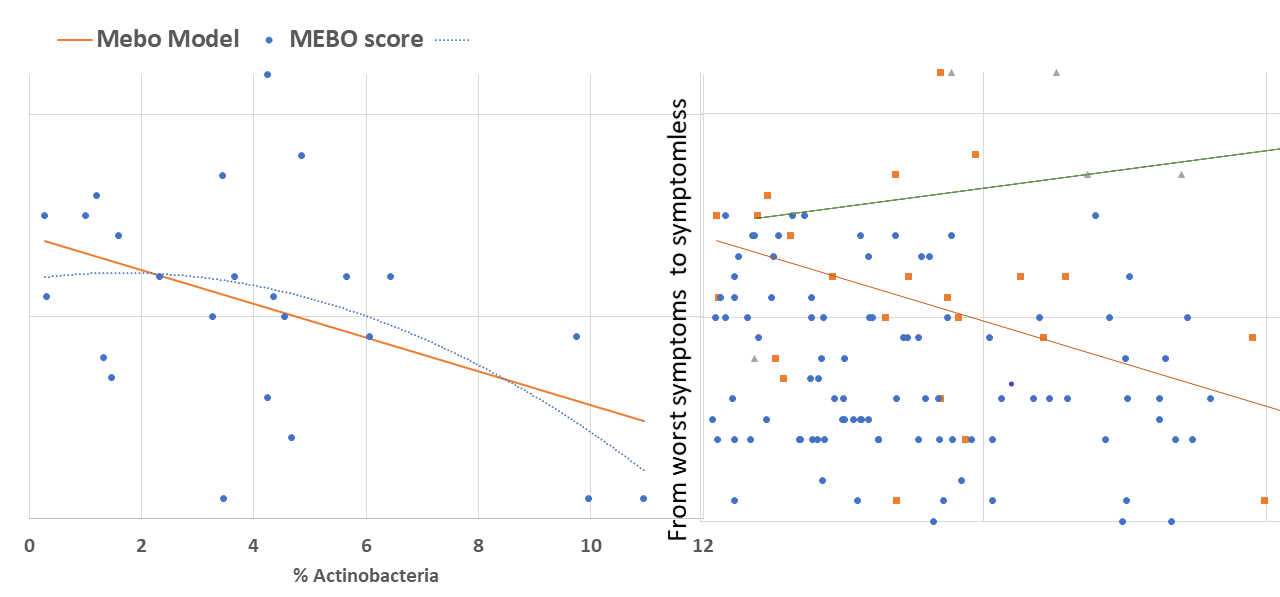
active/progressing, regressing or they were in remission. We decided to start our exploratory analysis from the subset of sufferers with "disappearing" symptoms - when participants felt they were on the road to improvement. The figure above shows a quick-and-dirty model describing how compositions of just 4 microbial classes could predict quality of life for these participants. Interestingly, these bacteria did not seem to be responsible for their MEBO or PATM symptoms, only overall wellbeing. The figure on the left shows how just one phylum of bacteria - Actinobacteria - correlates with the severity of MEBO symptoms in those whose condition is improving. It's very noisy, but it seems that increasing numbers of this bacteria (responsible for the pleasant smell of rain) helps to improve odor. Yet, look what happens when we throw in data from those with active disease or in remission (right section of the figure above) - the pattern is completely lost. Even more so, looks that those who already achieved remission care less about this bacterium and sometimes even slightly benefit (at least, in their own opinion) if they slightly reduce its population. Obviously, we need to subdivide the data better before attempting to build predictive models and look at a lower level of microbial hierarchy.
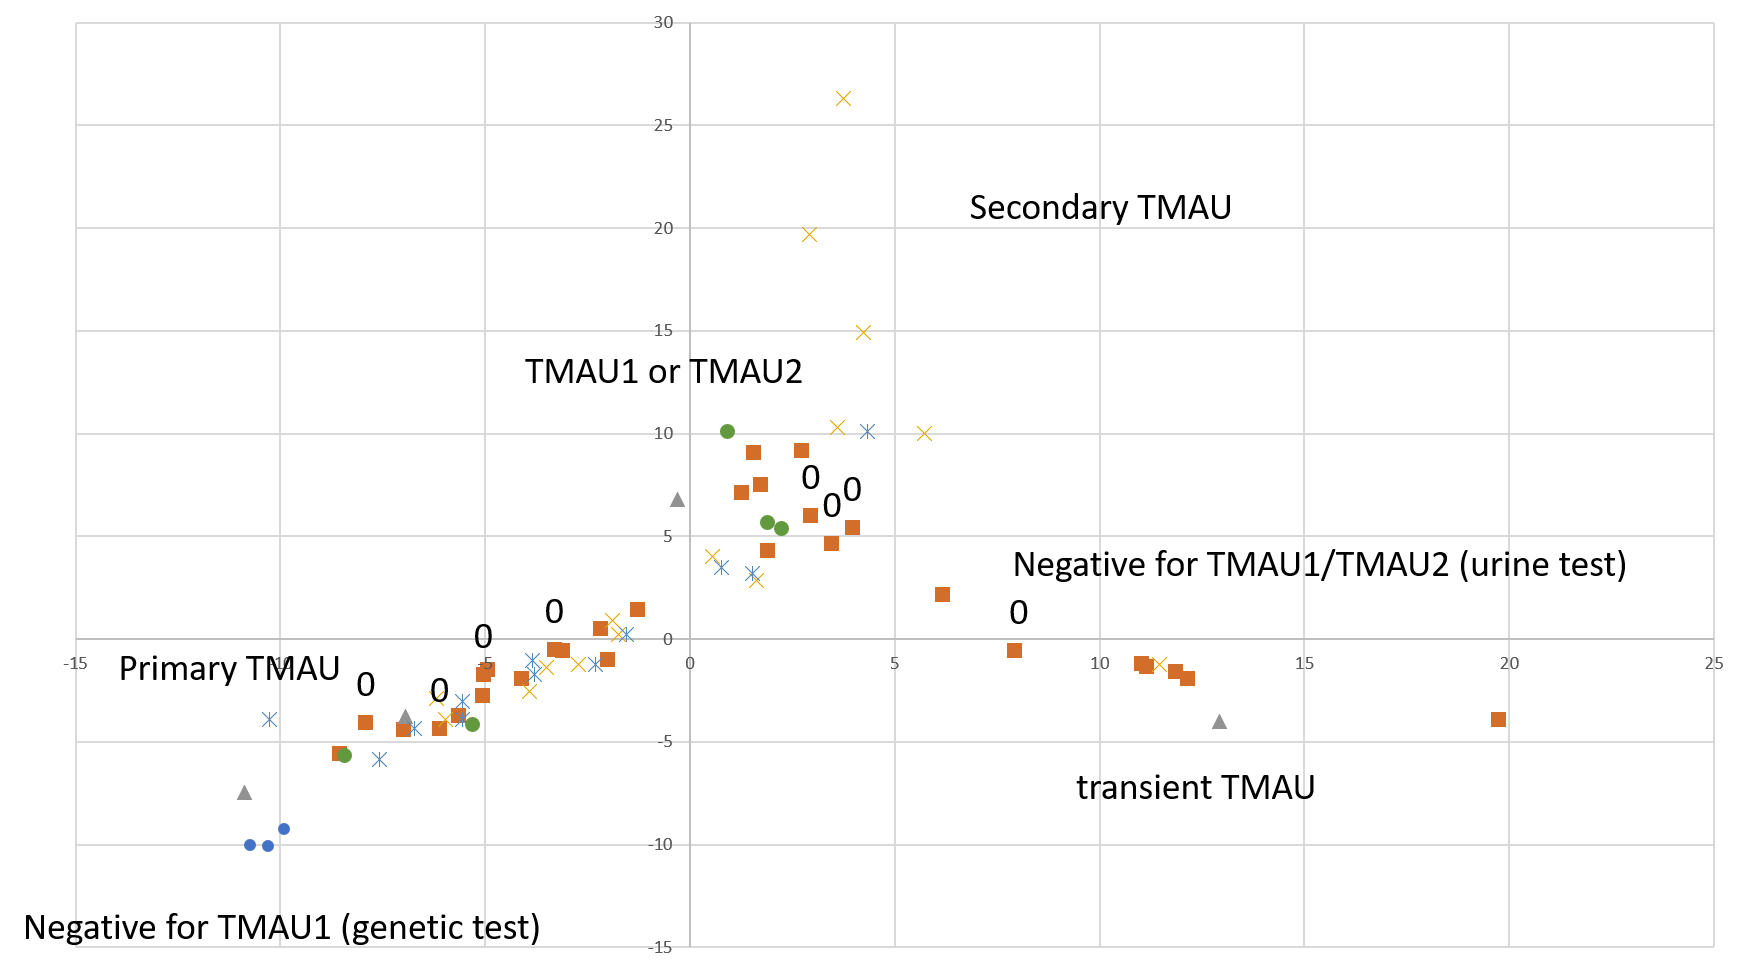
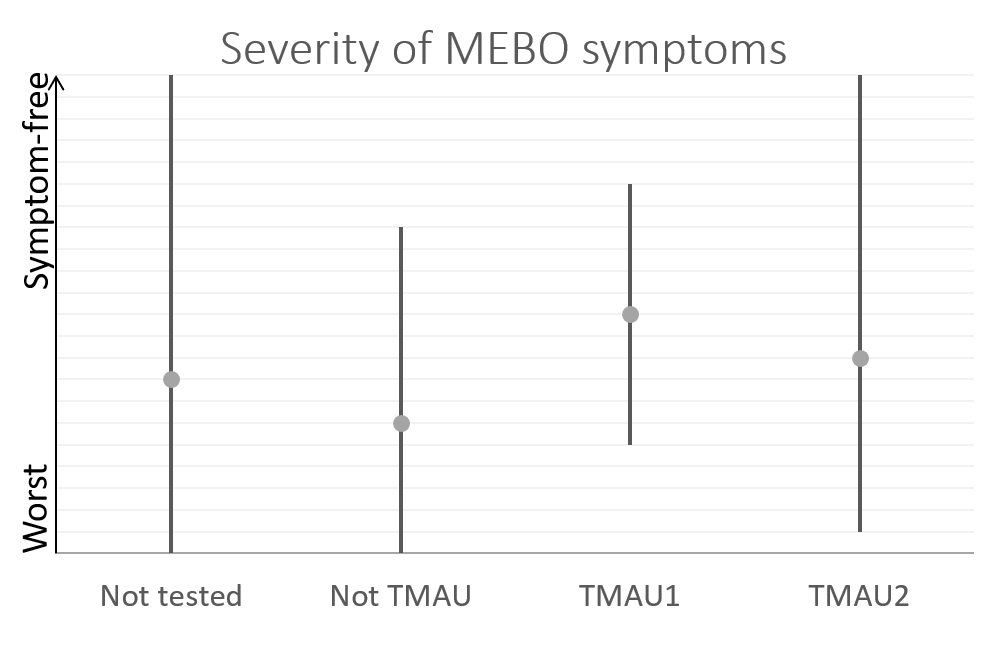
A quick-and-dirty principal component analysis of available samples vs all microbial species (figure on the right) shows that our research participants that tested negative for TMAU have different microbial profiles than those who tested positive, and microbiome for TMAU1 is different from TMAU2.
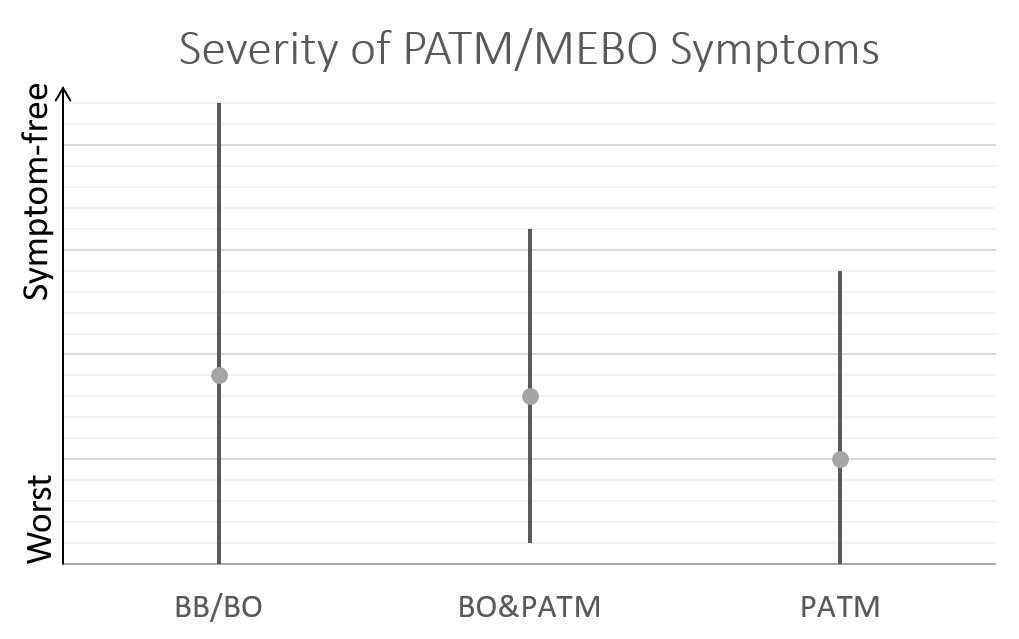
So far, we have over 40 samples of those negative to TMAU1 and TMAU2, and over 30 samples of those diagnosed as either TMAU1 or TMAU2, dozens of samples of those with PATM with or without body odor or bad breath. Interestingly these groups significantly differ in the self-perceived severity of their symptoms.
Average MEBO score is the worst for those diagnosed negative to TMAU. (The figures show average MEBO scores along with their variations) Surprisingly, it's the best for those diagnosed with the most severe form of TMAU - TMAU1! This shows that it's possible to learn to control symptoms even in extreme cases.
PATM symptom severity is even lower than MEBO symptoms for TMAU-negative individuals.
In our next posts we will be looking at the potential of microbiome for diagnosis of different sub-conditions, such as TMA1, TMA2, PATM and other subtypes.
We'll be also looking at different subgroups of bacteria - such as Enterobacteria that reduces TMAO to TMA Multiple research studies including correlation of metabolomic data from mixed microbiota fermentation systems did not give a true picture of which members of the gut microbiota were responsible for converting TMAO to TMA, and we hope to get a better insight.
Big thanks to all those who were able to complete the study - we know that it was quite a challenge for some! Thanks to those who contributed at least one sample along with the QoL questionnaire. Thanks to all who donated their samples, even though they had to pay for it out of their own pocket. Let's continue to work hard together to find the solution.
REFERENCES
Hoyles L, Jiménez-Pranteda ML, Chilloux J, Brial F, Myridakis A, Aranias T, Magnan C, Gibson GR, Sanderson JD, Nicholson JK, Gauguier D. Metabolic retroconversion of trimethylamine N-oxide and the gut microbiota. Microbiome. 2018 Dec;6(1):73.
Qiu L, Tao X, Xiong H, Yu J, Wei H. Lactobacillus plantarum ZDY04 exhibits a strain-specific property of lowering TMAO via the modulation of gut microbiota in mice. Food & function. 2018;9(8):4299-309.
Gabashvili IS. Community-led research discovers links between elusive symptoms and clinical tests. bioRxiv. 2017 Jan 1:139014.
Update on Clinical trial NCT03582826: Microbial Basis of Systemic Malodor and PATM Conditions
Recruited: 110 participants
Update on Clinical trial NCT03582826: Microbial Basis of Systemic Malodor and PATM Conditions
Recruited: 110 participants
Participated in the study (at least partially): 74
Submitted 3 or more samples: 48
Submitted 2 samples: 13
Submitted 1 sample: 13
Submitted 2 samples: 13
Submitted 1 sample: 13