We are very close to concluding our clinical trial NCT03582826 according to the pre-specified protocol.
Recruitment for our microbiome study commenced in June 2018 and completed in December 2018. The last batch of raw FASTQ sequences and raw taxonomy-level abundance summaries was received in October 2019. We had to spend more time on collecting and processing annotation data (medical histories, dietary intakes, medications, etc), ensuring quality, completeness, consistency and validity, and defining best approaches of dealing with "missing values".
We have now completed final data collection for the primary and secondary outcome measures, de-identified data and combined it with other donated results, as seen in the consort flow diagram. A table of baseline demographic and clinical characteristics for each study group is shown below. We may adjust some of these numbers as we followup with the participants.
Table 1. Baseline demographic and clinical characteristics
We see patterns in data potentially associated with sub-types and severity of symptoms, but to evaluate the validity of these results, factors that might distort the true association and/or influence its interpretation need to be carefully considered. We need to evaluate the role of bias and consider the study's statistical precision. We performed these analyzes for raw taxonomies and will report it in the next posts. Next steps will be to analyze actual DNA sequences to predict metabolic function.
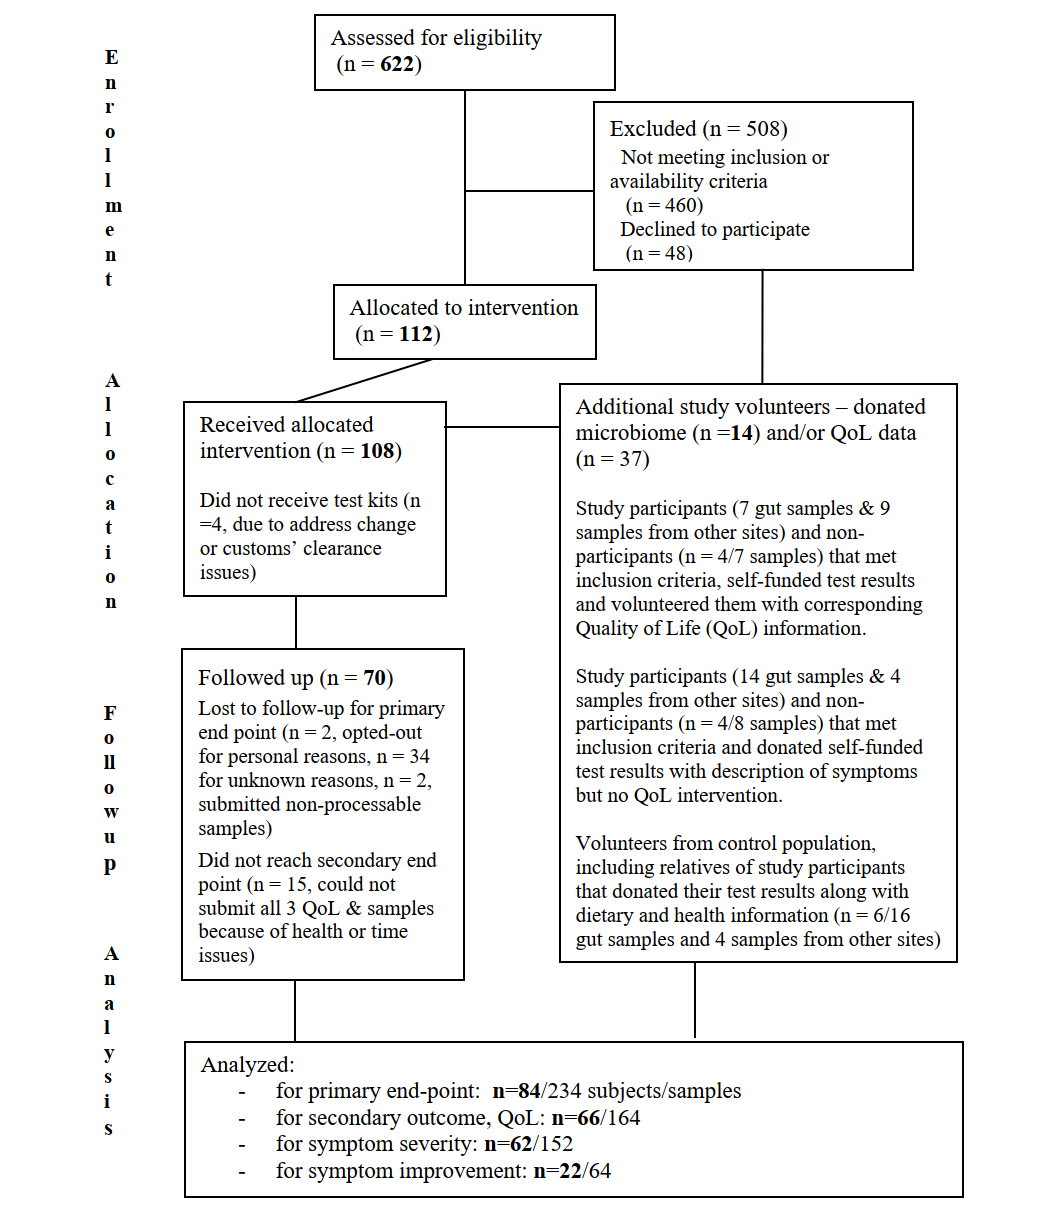 |
| Consort Diagram |
Recruitment for our microbiome study commenced in June 2018 and completed in December 2018. The last batch of raw FASTQ sequences and raw taxonomy-level abundance summaries was received in October 2019. We had to spend more time on collecting and processing annotation data (medical histories, dietary intakes, medications, etc), ensuring quality, completeness, consistency and validity, and defining best approaches of dealing with "missing values".
We have now completed final data collection for the primary and secondary outcome measures, de-identified data and combined it with other donated results, as seen in the consort flow diagram. A table of baseline demographic and clinical characteristics for each study group is shown below. We may adjust some of these numbers as we followup with the participants.
Table 1. Baseline demographic and clinical characteristics
| Characteristic | Value / N=84 |
| Age (years; mean (SD)) | 40 (12) |
| Gender (male/female; N) | 34/50 |
| Age (female, years; mean (SD)) | 42 (11) |
| Age (male, years; mean (SD)) | 37 (12) |
| TMAU positive (n (%)) | 20 (24%) |
| TMAU1 | 8 (10%) |
| TMAU2 | 9 (11%) |
| Intermittent TMAU | 2 (2%) |
| genetic but not metabolic positive | 1 (1%) |
| TMAU negative (n (%)) | 17 (20%) |
| PATM (n (%)) | 37 (44%) |
| PATM without odors (n (%)) | 2 (2%) |
| Feet odor w/other odors (n (%)) | 14 (17%) |
| Genital odor w/other odors (n (%)) | 9 (11%) |
| Bad breath w/other odors (n (%)) | 47 (56%) |
| Bad breath without body odor (n (%)) | 2 (2%) |
| Underarm odor w/other odors (n (%)) | 13 (16%) |
| Scalp odor w/other odors (n (%)) | 6 (7%) |
| Baseline MEBO score (min-max, med; IQR) | 3-25,11; 7 |
We see patterns in data potentially associated with sub-types and severity of symptoms, but to evaluate the validity of these results, factors that might distort the true association and/or influence its interpretation need to be carefully considered. We need to evaluate the role of bias and consider the study's statistical precision. We performed these analyzes for raw taxonomies and will report it in the next posts. Next steps will be to analyze actual DNA sequences to predict metabolic function.